Data USA

Data USA is a comprehensive visualization of U.S. public data organized around a pastiche of profiles ranging from Counties, Metro Areas and Cities to Industries, Occupations and Education.
DataViva
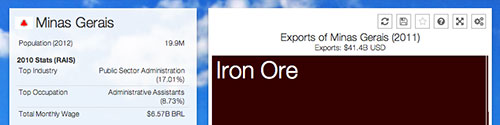
DataViva is a tool for collaborative planning built for the Brazilian State of Minas Gerais. It shows export and employement data for every municipality in Brazil for the past 10 years.
The Observatory
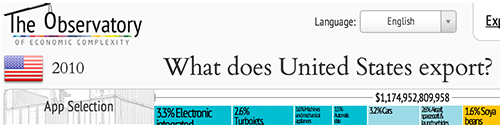
The Observatory is and open source web application providing a set of visualizations describing the trade flow of countries and products with data dating back to 1962.
HDI Tree
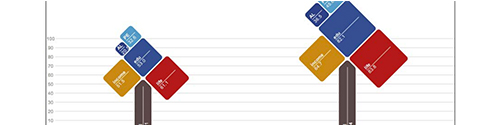
A re-imagining of the UN Human Development Report's annual Human Development Index (HDI). From initial design exploration to the full actualized dynamic app.
Paper Trail

A visualization of the technical papers written for and published by the SIGGRAPH organization. View trends over the years and the network of connected authors.